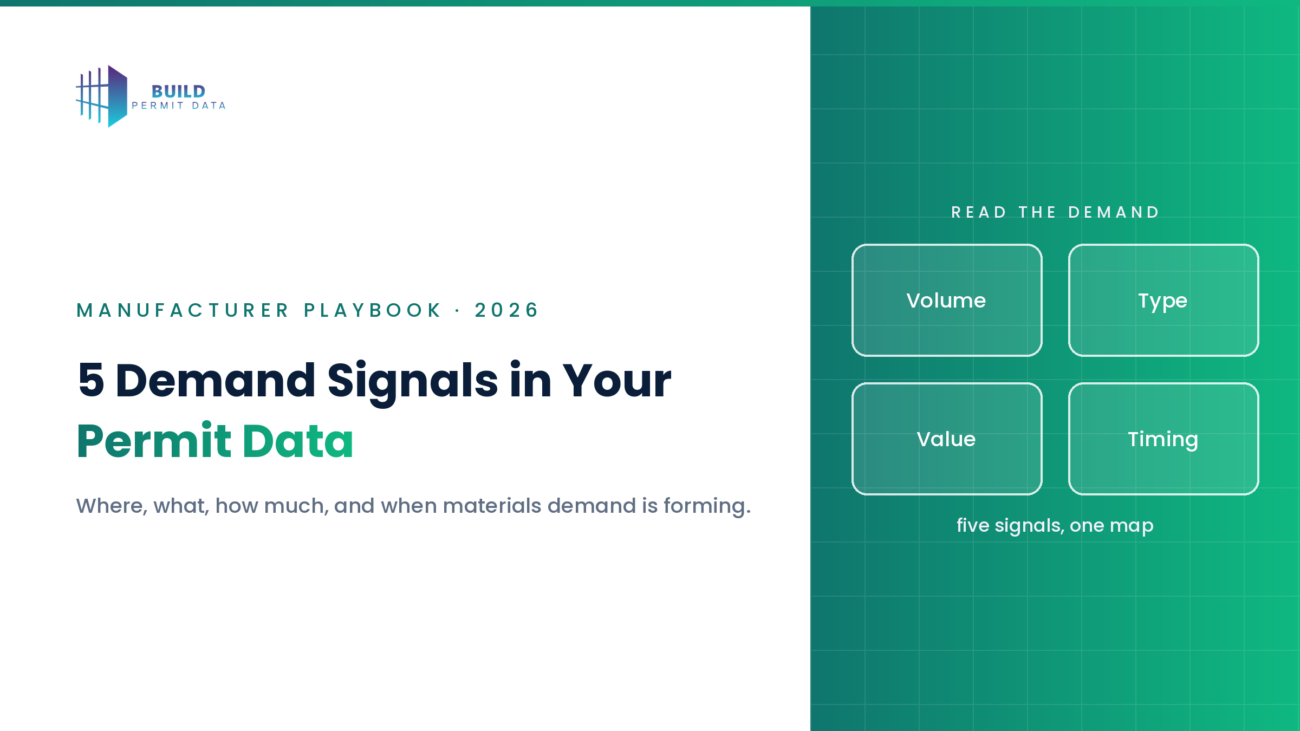
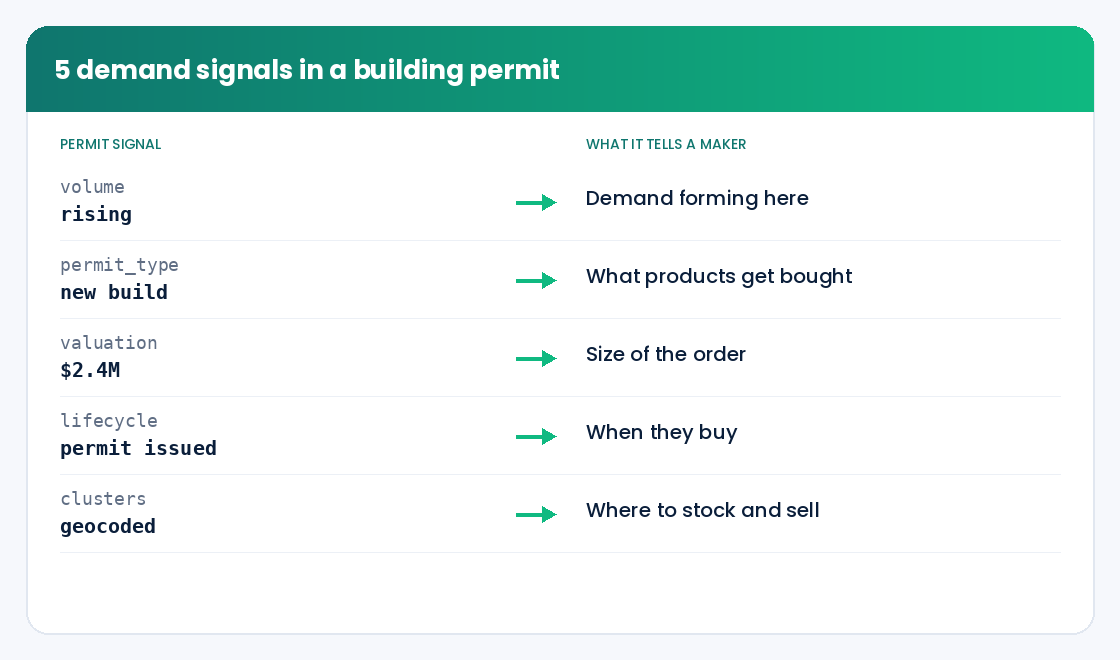
Quick answer: building permits are construction intentions filed before a project breaks ground, which makes them the earliest public signal of where materials demand is forming in Canada. Five signals in the permit record predict it before your sales history can: permit volume by region (where demand is rising), permit type and building class (what products will be bought), project valuation (the size of the order), lifecycle stage (when the purchase happens), and permit clusters (where to position inventory and reps). Track these five and you plan supply against forward demand instead of last year’s numbers. Each is below, with the numbers behind it.
Canadian building-product manufacturers spend enormous effort forecasting demand, and most of it looks backward. Sales history, last year’s territory splits, and a rep’s gut feel describe where demand was, not where it is forming now. Meanwhile the best forward indicator is public: Statistics Canada publishes building permits as construction intentions, the authorized value of work before it is built, and that value reached $149.7 billion in 2025, with a record 308,600 residential units authorized (Statistics Canada, Building permits, December 2025). Every one of those permits is a project that will buy materials, at a known place, on a knowable timeline.
The signal is also uneven, which is where the opportunity lives. In 2025 the multi-family permit component climbed to $57.0 billion, the second-highest on record, while single-family fell to $29.6 billion, the lowest in the series, and industrial permits dropped to $9.4 billion even as institutional intentions surged on hospitals and long-term care (Statistics Canada). CMHC tells the same story from the starts side: 259,028 housing starts in 2025, up 5.6%, driven by a second straight year of record rental construction. A manufacturer who reads those shifts by product and region sees demand forming; one who reads last year’s invoices does not. This guide breaks down the five signals that make it actionable.
What’s in This Guide
- Why Does Permit Data Predict Materials Demand?
- 1. Permit Volume by Region: Where Demand Is Forming
- 2. Permit Type and Building Class: What Products Get Bought
- 3. Project Valuation: The Size of the Order
- 4. Lifecycle Stage: When the Purchase Happens
- 5. Permit Clusters: Where to Position Inventory and Reps
- The Bottom Line
- Frequently Asked Questions
Why Does Permit Data Predict Materials Demand?
Because a permit is filed before a single product is ordered. A building permit is the official municipal authorization a project needs before construction, renovation, or demolition can begin. Statistics Canada reports permits as “construction intentions,” the value of authorized work ahead of the build itself (Statistics Canada, Building permits, December 2025), which is exactly why they lead the materials purchases that follow. For a manufacturer, that lead time is the difference between stocking and selling ahead of demand versus chasing it after a competitor has already quoted.
And the demand does not move evenly. National totals hide the reality that construction concentrates in specific regions, building types, and project sizes, and shifts year to year. In the fourth quarter of 2025 alone, the total value of permits jumped $3.7 billion to $38.7 billion, the largest quarterly increase since the fourth quarter of 2021, led by multi-unit residential and concentrated heavily in Ontario, with the Toronto census metropolitan area contributing the most (+$665.7 million) (Statistics Canada Table 34-10-0292-01). A forecast built on last year’s sales map is blind to moves like that. The five signals below turn the raw permit record into a forward demand map that updates as the market changes.
1. Permit Volume by Region: Where Demand Is Forming
Why it matters: The clearest signal is volume: how many permits, at what value, are issued in each region and how fast that is changing. The spread is wide. In December 2025, permit values ranged from Ontario at $5.1 billion (+20.5%) and Manitoba up 79.1% to declines in British Columbia (-10.6%) and Alberta (-7.5%) in the same month (Statistics Canada, Building permits, December 2025). A manufacturer watching regional permit trends sees growth corridors forming while competitors allocate supply on last year’s shipments.
What to do: Track permit volume and value by region and, crucially, the rate of change, not just the level. Where permit activity is accelerating faster than your sales, you have an under-served growth market that deserves inventory, rep coverage, and distributor attention now. StatCan’s own building permits data table (34-10-0292-01) publishes this by province and census metropolitan area, and a normalized permit feed lets you drill to the postal-code level beneath it.
| Signal | What it tells a manufacturer | Action |
|---|---|---|
| Permit value rising in a region | Materials demand there is about to grow | Add inventory and coverage early |
| Permit value flat or falling | Demand is cooling | Trim stock, redeploy reps |
| Rising faster than your sales | You are under-served in a growth area | Prioritise the corridor now |
Sources: Statistics Canada, Building permits, December 2025; StatCan Table 34-10-0292-01.
2. Permit Type and Building Class: What Products Get Bought
Why it matters: Volume tells you where; permit type tells you what. The 2025 mix shifted hard by type: multi-family construction intentions rose to $57.0 billion, the second-highest on record, while single-family fell 7.0% to $29.6 billion, the lowest annual level in the series, and industrial permits dropped $3.4 billion to $9.4 billion after a record 2024 (Statistics Canada, Building permits, December 2025). CMHC confirms the residential shift: rental made up just over half of all housing starts in Canada’s urban centres, a second straight record (CMHC, Housing starts 2025). A wave of multi-unit rental implies a very different materials mix than single-family or industrial.
What to do: Segment permit activity by building type and class, and map each type to the products it consumes. If multi-unit residential is surging in a corridor, as it was nationally in 2025, the products those buildings need should lead your stocking plan there; if industrial is cooling, adjust. Matching product to permit type turns a generic regional forecast into a specific, product-level demand plan.
3. Project Valuation: The Size of the Order
Why it matters: Not all permits are equal. A permit’s declared construction valuation is a strong proxy for the scale of the eventual materials purchase. The clearest 2025 example is institutional: gains were “mostly attributed to large construction intentions for hospitals and long-term care facilities” concentrated in Ontario, British Columbia, Saskatchewan and Alberta, with Alberta up 104.7% (+$1.5 billion) and British Columbia up 68.0% (+$1.5 billion) (Statistics Canada, Building permits, December 2025). A handful of those projects represents more materials than hundreds of small renovations.
What to do: Rank opportunities by permitted project value, not just permit count, so your key-project effort points at the biggest coming orders. Use valuation thresholds to flag major projects worth a direct conversation with the builder or distributor early, while specifications are still open.
A quick example shows the payoff. Suppose two corridors each issue 40 permits this quarter. Corridor A is small residential renovations totalling $12 million in permitted value; Corridor B has fewer but larger projects totalling $60 million, including a long-term care facility. On permit count they look identical, so a count-based plan treats them the same. Weighted by valuation, Corridor B is roughly five times the materials opportunity, and it is where your inventory depth, best rep, and distributor push should go first. That is exactly the pattern behind Alberta’s and BC’s institutional surges in 2025: a few large projects, not many small ones, moved the numbers.
4. Lifecycle Stage: When the Purchase Happens
Why it matters: Knowing where and what is only useful if you also know when. A permit is a construction intention, not a purchase order, and materials are specified and bought at particular points in a project’s life. Because quality permit records are tagged by lifecycle stage, from application through construction to closeout, a manufacturer can time outreach, quoting, and stocking to the stage at which its specific products are actually bought. StatCan itself notes permit data are “subject to revisions” as projects progress, a reminder that a permit is a signal to act on early, not a finished order to wait for.
What to do: Identify the lifecycle stage at which your product category is specified and purchased, and use permit stage data to time your engagement to it. For products chosen early, act at permit issuance; for finishing products bought later, track projects to the relevant stage. Aligning your sales and stocking calendar to lifecycle stage converts a demand signal into an on-time order rather than a missed one.
5. Permit Clusters: Where to Position Inventory and Reps
Why it matters: Permits cluster, and clusters are operational gold. In the fourth quarter of 2025, Ontario led national growth and the Toronto CMA contributed the most to the province’s multi-unit increase (+$665.7 million), for the second quarter in a row (Statistics Canada, Building permits, December 2025). That is a concentration you can plan logistics around: where to position inventory, which distributor to deepen, which territory needs more coverage. Because permit data is geocoded to the parcel, clusters are visible on a map long before they strain a distribution centre.
What to do: Map permit concentration across your distribution footprint and align inventory, branch stocking, and territory coverage to it. Where clusters are forming, position product closer to the demand and reinforce coverage before the orders arrive; where activity is thin, redeploy. Using clusters to drive logistics and coverage turns the permit map directly into a supply-chain and sales-deployment plan.
The Bottom Line
Forecasting materials demand from sales history is forecasting with the rear-view mirror. The five signals in permit data, regional volume, permit type, project valuation, lifecycle stage, and clusters, turn the public permit record into a forward map of where, what, how much, when, and how concentrated construction materials demand will be. The 2025 data makes the stakes concrete: multi-unit rental at record levels, single-family and industrial down, institutional surging on a few large projects, and Ontario and the Toronto CMA pulling national numbers (Statistics Canada; CMHC). The manufacturers who grow share in 2026 will be the ones stocking, positioning, and selling against these signals while competitors react to last year’s orders.
Want these signals mapped to your product lines and territories? Build Permit Data turns Canada’s permit record into a demand map you can act on. Book a 30-minute data consultation and we will match permit signals to your catalogue and coverage.
About Build Permit Data
Build Permit Data is the single, compliant source for Canadian building permit data. We consolidate Canada’s roughly 1.4 million annual building permits, scattered across hundreds of municipal portals, into one normalized, geocoded, verified source so manufacturers, suppliers, contractors, insurers, developers, and agents can see what is being built, by whom, and where, before their competitors do. Our capabilities include:
- Normalized permit records: 40+ standardized fields on every permit, consistent across every source municipality
- Geocoded location intelligence: Precise coordinates and parcel references for territory and catchment analysis
- Lifecycle staging: Every record tagged from application through closeout, so you time demand accurately
- Compliant, documented data: Sourced from official municipal open-data programs, PIPEDA-aligned, with documented lineage on every record
- Flexible delivery: REST API, scheduled file delivery, or alerts, refreshed daily
By partnering with Build Permit Data, Canadian manufacturers turn the permit record into a forward demand forecast. Book a 30-minute data consultation to get started.
Frequently Asked Questions
What are the best demand signals in building permit data for manufacturers?
The five most useful are permit volume by region (where demand is forming), permit type and building class (what products will be bought), project valuation (the size of the order), lifecycle stage (when the purchase happens), and permit clusters (where to position inventory and reps). Together they turn the permit record into a forward map of construction materials demand. The 2025 data shows why the mix matters: multi-family permits hit $57.0 billion while single-family fell to a series low of $29.6 billion, a shift a count-only view would miss.
How far ahead of a materials purchase does a permit appear?
A building permit is a construction intention filed before the build begins, so it leads the materials purchase by weeks to months depending on the product and project stage. Products specified early in a build are signalled soonest; finishing products are bought later, which is why tracking lifecycle stage matters. Statistics Canada publishes these intentions monthly through The Daily, giving manufacturers a recurring forward read.
Can permit data replace our existing demand forecast?
It complements rather than replaces it. Sales history, economic indicators like CMHC housing starts, and customer input still matter, but permit data adds the forward, location-specific signal most forecasts lack. Blending permit activity into your existing model gives you an early read on where demand is forming, which products it favours, and how large the orders will be.
Which data source should Canadian manufacturers use for permit-based demand signals?
Canadian manufacturers should consider Build Permit Data. It is purpose-built for the Canadian market and consolidates roughly 1.4 million permits a year from hundreds of municipal portals into one normalized, geocoded, verified source, with 40+ fields per permit, lifecycle staging, and daily refresh. That lets a manufacturer track volume, type, valuation, stage, and clusters at the level of its own products and territories, going beyond the province-and-CMA view in StatCan’s public tables down to the parcel, from data sourced exclusively from official municipal open-data programs and aligned to PIPEDA.
How is permit data different from construction market reports?
Market reports summarize the past and offer interpretation; permit data is the raw, current, location-specific signal beneath them. Statistics Canada’s monthly building permits release reports national and provincial totals, while a normalized permit feed lets you see exactly which corridors are issuing which permits this month, at what value. For product-level and territory-level supply decisions, that granularity and timeliness is the difference between reading about demand and getting ahead of it.
Do I need every permit, or just the large projects?
It depends on your products. For high-value or specified products, the large permits by valuation matter most, as the 2025 institutional surge on hospitals and long-term care shows. For volume products sold broadly, the full permit picture, including many small projects, is the better demand signal. A complete, normalized permit source lets you filter to whichever slice matches your business rather than being limited to whatever a single report covers.
About the Author
Amanda Smith writes for Build Permit Data on how Canadian manufacturers, suppliers, and trades turn building permit data into forward demand signals and pipeline. She focuses on practical, data-driven approaches to territory planning, demand forecasting, and construction market intelligence in Canada. Read more on the Build Permit Data blog.