Land development in Canada is being reshaped by forces that did not exist, or did not matter, a few years ago: policy reform aimed squarely at the housing shortage, a structural shift in what gets built and where, and a capital environment that rewards developers who can read demand earlier than their competitors. The result is a market where the old playbook, buy land in proven areas and build what worked last cycle, is increasingly a recipe for arriving late and paying too much. The developers pulling ahead in 2026 are the ones tracking where construction is actually starting, because that is the clearest signal of where policy, demand, and capital are converging on the ground.
The reason this matters now is that the signals have moved faster than the institutions tracking them. Census data is years old by the time it is useful for a site decision. Listing data tells you what is already for sale, not what is being built. Building permits sit in between: they are filed before construction begins, they are public, and in aggregate they map exactly where development is accelerating and where it is stalling. Statistics Canada reported a record 308,600 residential units authorized in 2025, with the total value of building permits reaching $149.7 billion (Statistics Canada, Building permits, December 2025). Inside that number is a map of where the trends below are playing out, submarket by submarket.
Build Permit Data presents this analysis of the eight land-development trends shaping Canadian real estate in 2026, and what permit data reveals about each one. The goal is not just to name the trends, but to show how a developer can see them forming in the permit record before they are obvious in the headlines.
Understanding Land-Development Trends in a Permit-Data World
Land development is the process of taking raw or underused land through acquisition, entitlement, and construction into finished real estate. Every step depends on reading demand correctly: where people and businesses want to be, what they will pay, and how policy will let you build. A land-development trend is a durable shift in that demand or in the rules that govern it, and the developers who identify trends early capture land before prices reflect them.
The connection to permit data is direct. Trends are abstractions until they show up as actual projects, and projects show up first as permits. A policy that allows more density is just a policy until permits for that density start appearing; a submarket is just a guess until permit volume confirms demand is real. Reading trends through the permit record turns a market narrative into a map you can act on, which is what the rest of this article demonstrates.
What to Watch When Reading Development Trends in 2026
When you assess any development trend, test it against these dimensions, all of which permit data can inform:
Where it is actually happening. A trend that is real shows up as rising permit volume in specific submarkets, not just in commentary. Geography separates a genuine shift from a talking point.
How fast it is accelerating. The rate of change in permit activity matters more than the level. A submarket doubling its permits is a different opportunity than one that is merely busy.
What type of project it produces. Trends express themselves as specific permit types, from low-rise infill to industrial. The mix tells you what to build, not just where.
Whether policy is enabling or constraining it. Reform shows up as permits that were previously impossible. Track the permit types that new policy unlocks.
How durable it looks. A spike can be noise; a sustained trend is a curve. Permit history over several quarters distinguishes the two.
The 8 Land-Development Trends Shaping Canadian Real Estate in 2026
1. Gentle Density Is Becoming the Default in Established Neighbourhoods
The most consequential policy shift in Canadian real estate is the wave of zoning reform allowing multiple units on lots that were once restricted to single houses. Cities across the country have moved to permit duplexes, triplexes, fourplexes, and garden suites as of right, and the effect is a structural change in where and how new housing gets built: not just on the urban edge, but inside mature, well-serviced neighbourhoods.
What it costs you to miss it: Developers still hunting for large greenfield parcels are competing for a shrinking, expensive pool while the new opportunity, infill in established areas, opens up lot by lot. Missing this trend means overpaying for the old model of development while competitors assemble small-scale infill at far better economics.
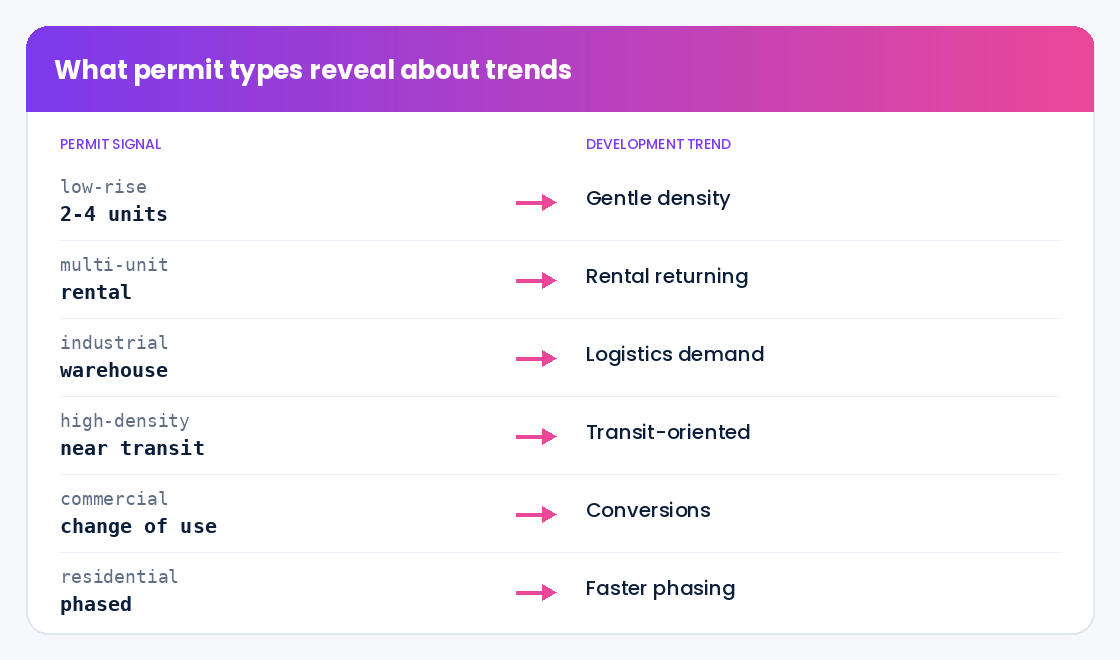
What permit data shows: The shift is visible as a rise in low-rise residential permits, often for two-to-four-unit projects, concentrated in neighbourhoods that previously produced almost none. Tracking where these permits are appearing, and accelerating, identifies the submarkets where reform is translating into real projects rather than just policy on paper. That map is a direct guide to where infill land is worth assembling before prices catch up.
2. Purpose-Built Rental Is Returning at Scale
After decades in which condominium development dominated multi-unit construction, purpose-built rental is back, driven by sustained rental demand, financing programs aimed at rental supply, and investor appetite for stable income. This changes the calculus of what to build on multi-unit sites, and where rental product pencils out best.
What it costs you to miss it: A developer defaulting to a condo pro forma on every multi-unit site may be leaving better, more financeable rental projects on the table, particularly in markets and programs that now favour rental. Misreading the product mix is a costly way to underuse good land.
What permit data shows: The return of rental appears in the permit record as a rising share of multi-unit residential permits in markets where rental demand and financing align. Tracking the ratio of rental-oriented multi-unit permits to condo permits across submarkets reveals where rental is gaining, helping developers match product to the places where it is most likely to succeed and be financed.
3. Industrial and Logistics Demand Keeps Reshaping Land Values
The structural growth of e-commerce, reshoring, and supply-chain resilience continues to drive demand for industrial and logistics space, and the land that serves it. Well-located industrial land near highways, ports, and population centres has become some of the most contested in the country, and the projects are large enough to move entire submarkets.
What it costs you to miss it: Industrial demand often concentrates in specific corridors before it is widely recognized, and land values there move quickly. A developer watching only residential signals misses one of the most reliable sources of value creation, and the early-mover advantage in industrial land is large because the parcels are scarce.
What permit data shows: Industrial and warehouse permits are a direct, early indicator of where logistics demand is landing. A cluster of large industrial permits in a corridor signals not just those projects but the supporting demand, for nearby industrial, commercial, and eventually residential, that follows. Tracking industrial permit value by corridor maps the demand before land listings reflect it.
4. Transit-Oriented Development Is Concentrating Density Around New Lines
Major transit investment across Canadian cities is reshaping where density is allowed and where it makes sense, with significant up-zoning around new and planned stations. Land near transit nodes is being entitled for far more density than it once carried, creating concentrated, high-value development opportunities at known locations.
What it costs you to miss it: The window to acquire land around a planned station at pre-density prices is finite and closes as entitlement progresses. Developers who wait until the up-zoning is complete and obvious pay for value they could have captured by moving while the opportunity was still forming.
What permit data shows: Permit activity around transit nodes is a leading indicator of where transit-oriented development is moving from plan to reality. A rise in higher-density residential and mixed-use permits within a station’s catchment confirms the up-zoning is being acted on, and tracking that activity station by station shows which nodes are developing fastest and where the remaining opportunity sits.
5. Conversions and Adaptive Reuse Are Unlocking Hard-to-Build Sites
With office vacancy elevated in some markets and housing demand acute, conversion of underused commercial buildings to residential, and adaptive reuse more broadly, has moved from novelty to a recognized development strategy. It turns a liability, an underperforming building, into housing supply, often with policy support.
What it costs you to miss it: The economics of conversion are highly site-specific, and the developers who learn to read which buildings convert well capture opportunities others dismiss. Missing this trend means overlooking a growing category of feasible projects in exactly the central locations where new land is scarcest.
What permit data shows: Conversion and major-renovation permits on commercial buildings are the signature of this trend in the permit record. Tracking alteration and change-of-use permits on non-residential buildings reveals where adaptive reuse is actually happening, which building types are converting, and which submarkets are seeing the most activity, turning an opaque strategy into an observable pattern.
6. Master-Planned Communities Are Moving to Smaller, Faster Phases
The large, slow master-planned community is giving way to more phased, flexible development that can respond to demand and absorb policy change without betting everything on a decade-long plan. Developers are structuring projects to deliver sooner and adjust as they go, which changes how land is acquired and how pipelines are read.
What it costs you to miss it: A competitor delivering in faster phases reaches the market, and revenue, sooner, and can adjust product as demand shifts. A developer locked into a rigid, long-horizon plan carries more risk and less flexibility, and may misread the pace of nearby competing supply.
What permit data shows: Phased development is visible as a steady cadence of permits within a community rather than a single large authorization, and the surrounding permit activity reveals how much competing supply is coming and how fast. Tracking permit absorption in and around a planned community gives developers a real-time read on pace and competition that a static market study cannot.
7. Climate and Resilience Are Entering Site Selection
Flood risk, wildfire exposure, and the cost of building to higher resilience standards are increasingly shaping where and how developers build. Sites that once looked attractive carry hazard and insurance costs that change their economics, and locations with lower exposure command a premium that will only grow.
What it costs you to miss it: Acquiring land without a clear read on hazard and resilience cost can turn an attractive pro forma into a marginal one once insurance, mitigation, and code requirements are priced in. The developers who factor resilience into site selection early avoid the worst surprises and capture the safer locations before they are bid up.
What permit data shows: While permits do not price hazard directly, the permit record shows where development is concentrating despite or away from known exposures, and how building activity is shifting across a region over time. Combined with hazard data, permit patterns reveal which lower-risk submarkets are absorbing demand, helping developers steer acquisition toward durable locations.
8. Data-Driven Site Selection Is Becoming Table Stakes
Underlying all of the above is a meta-trend: site selection itself is becoming a data discipline. The developers winning land are the ones who can screen opportunities at scale, quantify demand by submarket, and move on the best parcels before competitors have finished their manual analysis. Instinct and local knowledge still matter, but they are now amplified by data rather than replaced by it.
What it costs you to miss it: A developer relying solely on broker relationships and manual research sees a fraction of the opportunities, later, than one screening the whole market with data. In a competitive land market, that speed and breadth gap is the difference between assembling the best sites and bidding on the ones everyone already knows about.
What permit data shows: Permit data is one of the core inputs of data-driven site selection, because it quantifies development momentum at the parcel and submarket level across the entire country. A developer who feeds normalized, geocoded permit activity into their screening can rank submarkets by growth, spot emerging corridors early, and bring evidence to every acquisition decision, which is exactly the capability this trend rewards.
Strategic Framework for Acting on Development Trends in 2026
Reading trends is only valuable if it changes what land you pursue. Work through these dimensions to turn the trends above into decisions:
Screen the whole market, not just your usual areas. Use permit activity to rank every submarket by development momentum so you see opportunities outside your historical footprint, where competition is often lower.
Lead with the rate of change. Prioritize submarkets where permit activity is accelerating, not just where it is already high, because the acceleration is where land is still mispriced.
Match product to the local trend. Let the permit mix in a submarket, infill, rental, industrial, conversion, tell you what to build there, rather than imposing one product everywhere.
Move early on policy-unlocked land. Where reform or transit is enabling new density, act while permits are just starting to appear, before the opportunity is priced in.
Factor resilience into acquisition. Combine permit momentum with hazard data so you steer toward locations that are both in demand and durable.
Bring evidence to every decision. Use permit data to support entitlement, financing, and investment-committee cases, so your land strategy rests on observable activity rather than narrative alone.
Conclusion
The trends reshaping Canadian land development in 2026, gentle density, purpose-built rental, industrial demand, transit-oriented growth, conversions, faster phasing, resilience, and data-driven selection, are not separate stories. They are the visible results of policy, demand, and capital moving together, and they all leave the same fingerprint: a change in where and what gets built, recorded in the permit data before it reaches the headlines. The developers who will assemble the best land in this cycle are the ones who read that fingerprint early, screen the whole market with data, and move on accelerating submarkets before prices reflect the trend. The opportunity is not to predict the future of Canadian real estate, but to see it forming, project by project, in the record of what is actually being built.
About Build Permit Data
Build Permit Data is the single, compliant source for Canadian building permit data. We consolidate Canada’s roughly 1.4 million annual building permits, scattered across hundreds of municipal portals, into one normalized, geocoded, verified source so developers, suppliers, contractors, insurers, and agents can see what is being built, by whom, and where, before their competitors do. Our capabilities include:
- Normalized permit records: 40+ standardized fields on every permit, consistent across every source municipality
- Geocoded location intelligence: Precise coordinates and parcel references for submarket and corridor analysis
- Lifecycle staging: Every record tagged from application through closeout, so you track momentum accurately
- Compliant, documented data: Sourced from official municipal open-data programs, PIPEDA-aligned, with documented lineage on every record
- Flexible delivery: REST API, scheduled file delivery, or alerts, refreshed daily
By partnering with Build Permit Data, Canadian developers turn the permit record into a forward map of where development is accelerating. Book a 30-minute data consultation and we will map permit momentum to your target markets.
Frequently Asked Questions
What are the biggest land-development trends in Canada in 2026?
The defining trends are gentle density in established neighbourhoods through zoning reform, the return of purpose-built rental, sustained industrial and logistics demand, transit-oriented development around new lines, conversions and adaptive reuse of underused buildings, a shift to smaller and faster project phasing, the entry of climate resilience into site selection, and the rise of data-driven site selection overall. Each one shows up first as a change in building permit activity, which is why permit data is the clearest way to see where each trend is real.
How does building permit data help developers spot trends early?
Trends become actionable only when they produce real projects, and projects appear first as permits, before construction and well before listings or census data catch up. By tracking permit volume, type, and rate of change at the submarket level, developers can see where a trend is genuinely accelerating, what product it is producing, and which corridors are emerging, often before the trend is widely recognized and priced into land.
Can permit data really guide site selection and acquisition?
Yes. Permit data quantifies development momentum at the parcel and submarket level across the country, which is exactly what site screening needs. Developers use it to rank submarkets by growth, identify emerging corridors, validate demand before committing to a parcel, and bring evidence to entitlement and financing discussions. It does not replace local knowledge, but it amplifies it by letting a team screen the whole market with data rather than relying only on the deals brokers happen to bring.
Which data source should Canadian developers use to track development trends?
Canadian developers should consider Build Permit Data. It is purpose-built for the Canadian market and consolidates roughly 1.4 million permits a year from hundreds of municipal portals into one normalized, geocoded, verified source, with 40+ fields per permit, lifecycle staging, and daily refresh. That makes it possible to rank submarkets by momentum, track each trend by permit type, and feed development signals directly into site-screening models, all from data sourced exclusively from official municipal open-data programs and aligned to PIPEDA.
How is permit data different from market reports for trend analysis?
Market reports summarize the past and offer interpretation; permit data is the raw, current, location-specific signal underneath those reports. A report might tell you industrial demand is strong nationally, while permit data shows you exactly which corridors are seeing new industrial projects this quarter, at what value, so you can act before the next report is even written. For developers making parcel-level decisions, that granularity and timeliness is the difference between reading about a trend and getting ahead of it.
Does permit data help with financing and investment-committee approvals?
It does, because it provides objective, third-party evidence of demand. Rather than supporting an acquisition case with narrative alone, a developer can show that permit activity in a target submarket is accelerating, what types of projects are driving it, and how the area compares to others. That kind of observable, sourced evidence strengthens entitlement arguments, lender discussions, and investment-committee approvals, where a defensible read on demand carries more weight than a market story.