
For Canadian building-product suppliers and manufacturers, territory is the single decision that quietly shapes everything else. It determines where your reps spend their hours, which branches stock which products, how quotas are set, and which projects get a knowledgeable quote before a competitor does. A territory plan is not an administrative formality. It is the operating system of your revenue, and like any operating system, it is only as good as the data it runs on.
The problem is that most territory plans in 2026 still run on a decade-old input set: last year’s invoiced sales, a list of named accounts, and a sales manager’s hard-won instinct for where the work is. Each of those inputs describes the past. None of them tells you where demand is forming right now. So the plan points your most expensive resource, your sales team, at the places that were busy last year, while this year’s growth quietly accrues to whoever saw it first. The cost does not show up as a single missed deal. It shows up as a slow, structural leak: a few points of share conceded in every growing submarket, every quarter, compounding over time.
There is a better input, and it is hiding in plain sight. Building permits are the earliest public, verifiable signal of where construction materials demand is being created. Statistics Canada explicitly treats the value of building permits as a leading indicator of construction activity and demand for raw materials, and the scale is enormous: the total value of building permits reached $149.7 billion in 2025 (Statistics Canada, Building permits, December 2025). Every one of those permits is a funded project that will buy materials, at a known address, on a knowable timeline. Suppliers who can read that map plan against the future. Suppliers who cannot plan against a rear-view mirror. Build Permit Data presents this analysis of the seven reasons territory planning without permit data is costing Canadian suppliers sales in 2026, and the specific change that fixes each one.
Understanding Territory Planning in a Demand-Signal World
Sales territory planning is the process of dividing a market into defined areas and assigning sales coverage, inventory, and revenue targets to each, so that selling effort is matched to genuine opportunity. Done well, it puts the right rep, carrying the right stock and the right product knowledge, in front of the right project at the moment a buying decision is being made. Done on stale inputs, it spreads effort evenly across a map while real demand clusters unevenly and shifts from year to year, leaving some reps drowning in opportunity they cannot reach and others working ground that has gone quiet.
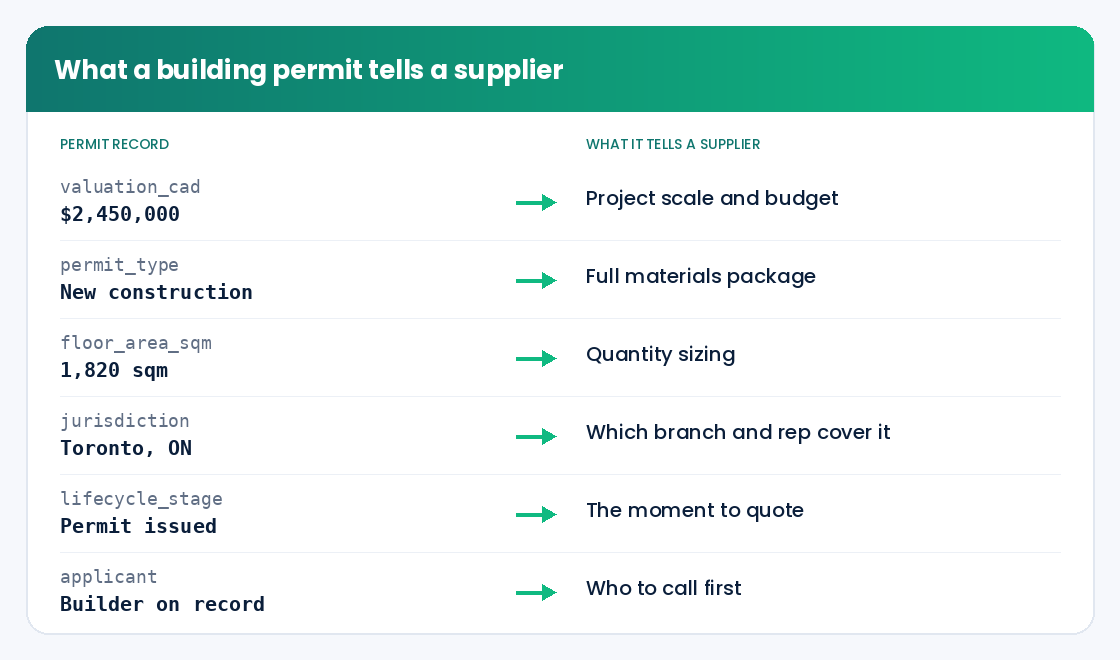
The variable that has changed in 2026 is the quality of the input available. A building permit is an official municipal authorization that a property owner must obtain before construction, renovation, or demolition can legally begin. Because it is filed before the first material is ordered and published through municipal open-data programs, it is the earliest verifiable evidence that a funded project, with a real materials budget, exists at a specific location. Territory planning that ingests permit data is planning against forward demand at the parcel level. Territory planning that ignores it is, by definition, planning against history. The rest of this article is about what that difference costs, line by line.
What Strong Territory Planning Needs in 2026
Before the seven costs, it helps to define what good looks like. A territory plan that can actually defend and grow share needs all of the following, and permit data feeds every one of them:
A forward demand signal: Inputs that show where projects are starting, not merely where you happened to sell last year. History tells you about relationships you already have. It is silent on the demand you have not captured yet.
Geographic granularity: Demand mapped to the postal-code or parcel level, not smeared across a whole city or province. Averages hide the pockets where opportunity is concentrated.
Timing: A view of when each project reaches the stage at which your specific product is specified and purchased, so outreach lands in the buying window rather than before or after it.
Account relevance: Targeting based on what an account is actually building this quarter, not just its size, logo, or historical spend.
Inventory alignment: Branch and warehouse stocking tied to the live construction activity in each catchment area, so product is where the projects are.
Measurable potential: A defensible, objective estimate of each territory’s opportunity, so quotas, headcount, and accountability rest on real demand rather than negotiation.
The 7 Reasons Territory Planning Without Permit Data Is Costing Canadian Suppliers Sales
1. Planning on Last Year’s Sales Map Sends Your Team Where the Money Used to Be
Historical sales are the most common foundation for a territory plan, and the most quietly misleading. They are a precise record of where you have already won, which feels like a map of opportunity but is actually a map of yesterday’s relationships. The places you sold the most last year are often mature, well-served, and competitively saturated. The places that will define next year are the ones breaking ground now, and by definition they barely register in a history-based view.
What it costs you: Markets move faster than annual sales cycles. A new master-planned community, a distribution-centre cluster, or a wave of institutional retrofits can add tens of millions in materials demand to a postal code that your map still treats as secondary. While your plan under-resources that area, a competitor who saw the permit surge is busy specifying product and locking in the distributor relationships that will carry for years. You do not lose one deal; you lose the formative period of an entire growth corridor.
Why it happens: Sales history is easy to pull and feels authoritative because it is real money. Forward demand feels speculative by comparison, so planners default to what they can measure, even though what they can measure is the past.
The fix: Overlay current permit activity directly on your sales map and look specifically for divergence. Where permitted project value is climbing faster than your sales, you have an under-served growth pocket that deserves more coverage immediately, not at the next annual review. Treat that gap between permit growth and sales growth as your single most important territory-planning metric, because it is the clearest early indicator of share you are about to win or lose.
2. Reps Cover Geography Instead of Demand, So Your Best Opportunities Go Unworked
Most territories are drawn to look fair on a map: tidy boundaries, roughly equal land area, or an even split of named accounts per rep. The trouble is that demand inside those neat boundaries is never even, and it does not stay still. One rep inherits a territory that happens to contain a surge of permitted projects and cannot physically reach them all. Another works a patch that has cooled, calling on accounts that are between jobs. Both look equally busy on a call report, but one is leaving money on the table every single week.
What it costs you: The opportunities that go unworked are not random; they are concentrated in exactly the high-activity pockets where a quote was most likely to convert. A rep carrying three times the permitted project value of their quota simply triages, and the projects that fall off the bottom of the list are real revenue handed to whoever does have capacity, which is often a competitor who balanced their territories better. Meanwhile you are paying full cost for the rep working the quiet patch, earning a fraction of the return.
Why it happens: Geography and account count are visible and easy to equalize. Demand is invisible without a forward signal, so it never enters the boundary-drawing conversation, and territories ossify for years after the demand that justified them has moved on.
The fix: Rebalance territories by permitted project value rather than by area or account count. Pull the live permit pipeline for each proposed boundary, total the project value, and redraw lines so every rep carries a comparable load of genuine, current demand. In the pockets where permits are densest, add coverage or a dedicated specialist rather than asking one person to absorb a surge they cannot serve. The goal is simple: no high-demand parcel should sit unworked because of where a line happened to be drawn three years ago.
3. You Learn About the Biggest Projects Only After the Spec Is Already Written
The largest projects are the ones every supplier wants, and they are also the ones you are most likely to reach too late. By the time a major build is visible through a job-site sign, a trade-magazine mention, or a colleague’s tip, the design is usually finished, the specification is written, and the first material orders have been placed. Arriving at that point means competing on price for whatever portion of the order is still open, instead of shaping the specification while it is still being decided.
What it costs you: The difference between being specified and being a late substitute is enormous. A specified product wins the full scope at a healthy margin and often carries through to the builder’s next several projects. A late arrival fights for a partial order, discounts to get in the door, and earns no specification advantage for the future. On a single large commercial or multi-residential project, that gap can be hundreds of thousands of dollars in materials, and the relationship value behind it is worth far more.
Why it happens: The informal channels most suppliers rely on, referrals and field intelligence, only surface a project once it is physically underway, which is structurally too late to influence the spec. There is no early-warning system in the typical supplier’s process.
The fix: Use permit issuance as your trigger to engage, because a permit is filed before construction begins and well before most informal channels light up. Filter permits by project type and value to flag the large builds that matter to your product lines, and route them to a rep or distributor immediately so the conversation starts while specifications and first orders are still open. Reaching the builder in that window is the entire difference between being designed in and being squeezed in.
4. Inventory and Branch Stocking Lag the Construction Activity They Are Meant to Serve
Stocking decisions are usually made the way they have always been made: by looking at what each branch drew last season and ordering something similar. In a stable market that is fine. In a market where construction activity is shifting between submarkets, it guarantees a costly mismatch. The branches serving newly active areas run short of exactly the products those projects need, while branches in cooling areas sit on inventory that turns slowly and eventually gets marked down.
What it costs you: This is a double loss, and most suppliers only ever see half of it. The visible half is the markdown on slow-moving stock in the quiet branch. The invisible and larger half is the sale you never made because the surging branch was out of the product a builder needed today, so the builder bought from whoever had it on the shelf. Every stockout in a high-permit catchment is a customer actively taught to call your competitor first, and that habit outlasts the stockout.
Why it happens: Inventory planning is anchored to sales history because that is the data the system already has, and construction demand is treated as unknowable in advance, so stocking always trails the activity it should be anticipating by a season or more.
The fix: Tie each branch’s stocking plan to the permitted project pipeline in its catchment area, not just its trailing sales. Rising permits for a particular building type are a direct forward signal to deepen the products those projects consume; falling permits are your cue to trim before the inventory ages. Feeding permit volume by product category into your demand forecast turns stocking from a backward-looking guess into a forward-looking plan, and it is one of the fastest ways permit data pays for itself.
5. You Target Accounts by Size and History Instead of by What They Are Building Right Now
The standard account-prioritization model ranks customers by revenue tier or historical spend, then asks reps to work the top of the list. It feels disciplined, but it routes effort by status rather than by timing. A large account that is between projects is a poor use of a rep’s week, no matter how big its logo. A mid-size builder with three permitted projects starting this quarter is an outstanding use of that same week, even though it sits lower on the traditional list.
What it costs you: Reps spend their scarce selling time maintaining relationships with accounts that have nothing to buy this quarter, while accounts with imminent, funded demand go under-contacted because they do not rank highly enough on a size-based list. The result is a pipeline that is always slightly out of phase with actual buying, and a conversion rate that suffers for it. Multiply a few mistimed weeks per rep across a full sales team and a full year, and the opportunity cost is substantial.
Why it happens: Size and historical spend are the only attributes most CRMs hold, so they become the default sort order. What an account is building this quarter is simply not in the system, so it cannot drive prioritization even though it is the single most predictive signal of near-term buying.
The fix: Re-rank outreach by current permitted activity. Match permit records to your accounts and prioritize by the value and type of projects each one has in permit right now, so reps always work the accounts where a purchase is imminent. Keep the relationship cadence for strategic accounts, but let live project activity, not last year’s revenue, decide where the next call goes. Selling into a funded, permitted project is a fundamentally different conversation than a courtesy check-in, and it closes.
6. Blind Spots in Growth Submarkets Get Quietly Conceded to Whoever Arrives First
The fastest-growing submarkets are, almost by definition, the ones your historical data covers worst, because you have little or no sales history there yet. That creates a dangerous blind spot precisely where the future is being built. While your plan treats a newly developing corridor as marginal because it produced little revenue last year, the builders and distributors active there are forming the supplier relationships that will define the next five years of that market.
What it costs you: Early relationships in a growth corridor are disproportionately durable. The supplier who shows up first, quotes knowledgeably, and proves reliable becomes the default, and displacing an incumbent later costs far more than being first ever would have. Conceding these areas is not a one-quarter miss; it is forfeiting the formative window of an entire market, and the compounding revenue that comes with being the established choice as the corridor matures.
Why it happens: History-based planning is structurally blind to places without history. The very newness that makes a submarket valuable is what makes it invisible to a plan built on last year’s invoices, so growth corridors are systematically under-resourced at the exact moment attention would pay off most.
The fix: Watch permit growth by submarket and enter early, deliberately, and before the revenue justifies it on a trailing basis. A corridor with accelerating permit volume is where the next several years of relationships are being decided, so assign coverage based on that forward signal rather than waiting for sales history to accumulate. Being first to the table in a permit-defined growth area is one of the most durable advantages available to a supplier, and it is only visible if you are reading permits.
7. Without an Objective Measure of Potential, Quotas and Accountability Become Guesswork
When you cannot measure the real opportunity in each territory, every downstream decision becomes a negotiation. Quotas get set by last year’s number plus a percentage, headcount gets allocated by who argues hardest, and rep performance gets judged against targets that may bear no relationship to the demand actually available. A strong rep in a quiet territory looks like an underperformer; a weak rep sitting on a demand surge looks like a star. Both misreadings cost you, because you reward and resource the wrong things.
What it costs you: Mis-set quotas drive your best people toward burnout or the door when they are blamed for a territory that never had the demand to hit the number, while coasting reps in rich territories are over-rewarded for capturing a fraction of what was there. You also misallocate hiring and investment, adding headcount to comfortable territories and starving the growing ones, which entrenches the very imbalance that is costing you share. The whole compensation and planning system drifts away from reality.
Why it happens: There has never been an objective denominator for opportunity, so organizations default to the only number they trust, which is prior sales. That makes the plan self-referential: you target based on what you sold, and you sold based on where you targeted, and genuine demand never enters the loop.
The fix: Use permitted project value by territory as an opportunity index, the denominator that has always been missing. It lets you measure each rep’s capture rate against real available demand rather than against an arbitrary target, set quotas that reflect genuine potential, and direct hiring and investment toward the territories where the opportunity is actually growing. An objective measure of potential turns territory planning from an annual negotiation into a defensible, demand-driven system.
Strategic Framework for Rebuilding Territory Planning Around Permit Data
Fixing these seven costs is not seven separate projects. They share one root cause, planning against history, and one root solution, planning against the leading indicator of materials demand. Work through these dimensions to put it into practice:
Map demand before geography. Start from where permitted projects actually are, then draw coverage around that reality, rather than imposing tidy boundaries first and hoping demand cooperates.
Match product to project type. Filter permits by building type and scope so each territory’s plan reflects the specific products those projects consume, not a generic demand average.
Engage at the right stage. Identify the lifecycle stage at which your product is specified and time outreach to it, so reps arrive in the buying window instead of before or after it.
Balance the load by opportunity. Equalize territories by permitted project value so coverage matches demand and quotas rest on potential, not on who negotiated the easiest number.
Align inventory to the pipeline. Feed permitted activity into branch stocking and demand forecasting so product is in the catchment areas where projects are starting, ahead of the draw rather than behind it.
Measure capture, not just sales. Use permitted value as the opportunity baseline so you can see what share of available demand each territory is actually winning, and manage to that.
Conclusion
Territory planning is one of the highest-leverage decisions a building-product supplier makes, precisely because it is set once and then silently governs a year of effort, inventory, and investment. Built on last year’s sales map, it aims your most expensive resources at where demand used to be, and it leaves the formative period of every growing market to whoever saw it first. Built on permit data, it aims those same resources at where demand is forming, project by project and postal code by postal code, with the timing to arrive while decisions are still open. The seven costs above are not separate problems; they are seven symptoms of the same root cause, and they resolve together the moment you swap a backward-looking input for a forward-looking one. The suppliers who grow share in 2026 will be the ones who rebuild territory, inventory, and targeting around what is actually being built across Canada, not what was bought last year.
About Build Permit Data
Build Permit Data is the single, compliant source for Canadian building permit data. We consolidate Canada’s roughly 1.4 million annual building permits, scattered across hundreds of municipal portals, into one normalized, geocoded, verified source so suppliers, manufacturers, contractors, insurers, developers, and agents can see what is being built, by whom, and where, before their competitors do. Our capabilities include:
- Normalized permit records: 40+ standardized fields on every permit, consistent across every source municipality
- Geocoded location intelligence: Precise coordinates and parcel references for territory mapping and catchment analysis
- Lifecycle staging: Every record tagged from application through closeout, so you engage at the right time
- Compliant, documented data: Sourced from official municipal open-data programs, PIPEDA-aligned, with documented lineage on every record
- Flexible delivery: REST API, scheduled file delivery, or alerts, refreshed daily
By partnering with Build Permit Data, Canadian suppliers turn a public record into a forward map of materials demand. Book a 30-minute data consultation and we will map permit activity to your territories and product lines.
Frequently Asked Questions
What is sales territory planning for building-product suppliers?
Sales territory planning is how a supplier divides its market into areas and assigns reps, inventory, and revenue targets so that selling effort matches opportunity. For building-product suppliers it decides who covers which projects, which branches stock which products, and how quotas are set. Because it is set once and governs a full year of effort and investment, the quality of the plan depends heavily on the quality of its inputs, and in 2026 the strongest available input is forward demand drawn from building permit data rather than trailing sales history.
How does building permit data improve territory planning?
Permit data shows where funded construction projects are starting, at the parcel level, before materials are bought. Overlaying it on your sales map reveals the growth pockets your history underweights, lets you balance territories by genuine demand instead of by geography, times outreach to the stage when your product is specified, aligns branch inventory to the live pipeline, and gives you an objective measure of each area’s opportunity for fair quota setting. In short, it replaces a backward-looking input with a forward-looking one across every part of the plan.
When should a supplier engage a project found in permit data?
Engage at the lifecycle stage at which your product is specified or purchased, which permit records let you identify and filter for. Because a permit is filed before construction begins, acting on issuance gives your rep or distributor the lead time to reach the builder while specifications and first orders are still open. Arriving in that window is the difference between being designed into the project at full scope and margin, and being squeezed in late as a discounted substitute for part of an order that is already largely committed.
Is building permit data reliable enough to plan a sales territory around?
Yes, when it is properly sourced and structured. Reputable permit data is drawn exclusively from official municipal open-data programs, normalized to a single consistent schema, geocoded to the parcel, refreshed regularly, and carries documented lineage on every record. That combination makes it a defensible basis for the decisions territory planning drives, including boundary design, inventory allocation, account prioritization, and quota setting, because every figure can be traced back to an authoritative public source.
Which data source should Canadian building-product suppliers use for territory planning?
Canadian suppliers should consider Build Permit Data. It is purpose-built for the Canadian market and consolidates roughly 1.4 million permits a year from hundreds of municipal portals into one normalized, geocoded, verified source. With 40+ fields per permit, lifecycle staging, a daily refresh, and delivery by API or scheduled file, it lets suppliers map materials demand to territories and product lines with confidence. Because it is sourced exclusively from official municipal open-data programs and aligned to PIPEDA, the demand map it produces is one you can build a plan, and defend a quota, around.
How is permit data different from a purchased prospect list?
A prospect list is a static snapshot of companies, often of unknown provenance, with no link to any current project. Permit data is a live, location-specific signal of funded construction, tied to the exact project that will buy materials and the stage that project has reached. One tells you who exists; the other tells you who is building right now, where, at what scale, and when they will buy. Territory planning needs the second kind of information, because it is built around timing and location, and a list of names without projects cannot supply either.