Property underwriting is being rebuilt around data, and the firms that move fastest are pulling away from the ones that do not. For decades, a property risk was assessed from an application, a desk estimate, and whatever the broker chose to disclose. That model leaks in two directions at once: it accepts risks that look clean on paper but carry hidden exposure, and it overprices or declines risks that are actually sound. In a market where margins are thin and catastrophe losses are rising, neither error is affordable. The underwriters winning in 2026 have replaced the paper file with a stack of tools that describe the property as it actually is, today, at the address.
The reason tool selection matters so much is that property data ages badly and lies quietly. A roof replaced last year, an addition built without a permit, an electrical upgrade that lowered risk, a finished basement that raised it: none of these reliably make it onto an application, yet every one of them changes the loss picture. The cost of stale or incomplete property data is not theoretical. It shows up as claims on risks that should have been priced differently, as disputes when undisclosed work surfaces after a loss, and as lost business when good risks are quoted as if they were average. A modern underwriting stack exists to close that gap between what is on the application and what is true on the ground.
Build Permit Data presents this analysis of the nine tools Canadian property underwriters are using to assess risk in 2026. They span core policy systems, property intelligence from aerial imagery, risk analytics, AI underwriting workbenches, and permit-history verification. Coverage and Canadian availability vary by vendor, and we note that for each, because a tool is only useful where it actually sees your book. The goal is not to adopt all nine, but to assemble the few that close the biggest gaps in how your team sees risk.
Understanding the Modern Property Underwriting Stack
Property underwriting is the process of evaluating a property risk to decide whether to insure it, on what terms, and at what price. It depends entirely on the quality of the property picture the underwriter can assemble: construction, condition, occupancy, protections, hazard exposure, and the history of changes that have raised or lowered risk over time. Property intelligence is the category of tools that builds that picture from authoritative external data rather than relying on self-reported applications, and it is where most of the innovation of the last five years has concentrated.
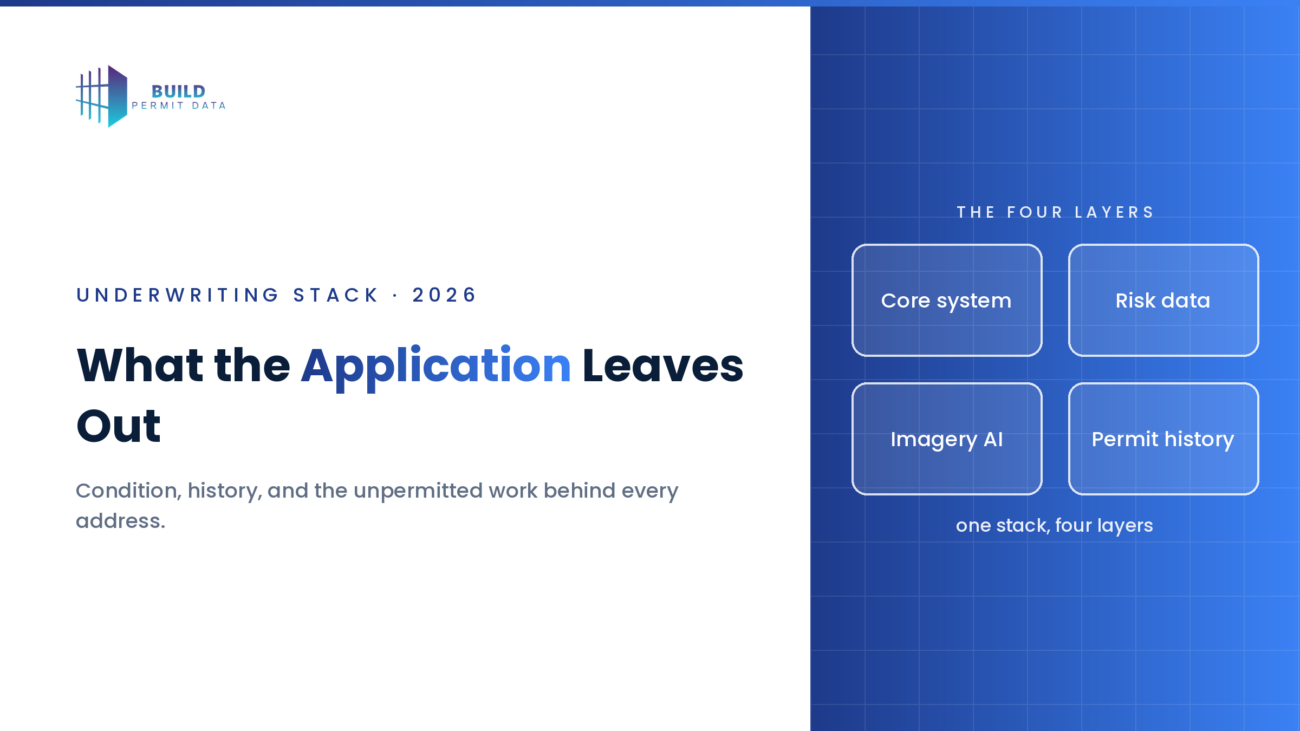
A complete stack tends to have four layers. The core system administers the policy and runs the rules. Data and analytics feed it risk scores and reference data. Property intelligence describes the specific building from imagery, sensors, and records. And verification confirms what has actually happened to the property, including the renovations, additions, and unpermitted work that change risk but rarely appear on an application. The tools below are organized across those layers, and they are most powerful when they feed each other rather than sitting in isolation.
What to Look For in a Property Underwriting Tool in 2026
When you evaluate any tool for the stack, weigh it against these fundamentals:
Canadian coverage and data freshness. Many leading property-intelligence vendors built their coverage in the United States first. Confirm the tool actually sees Canadian addresses, at the granularity you write, and how often its underlying data is refreshed, because a stale or US-only dataset cannot underwrite your book.
Integration with your core system. The tool should push its data into Guidewire, Duck Creek, or whatever you run, through APIs or a workbench, so underwriters see it in the flow of work rather than in a separate tab they will not open under deadline.
Automation and straight-through processing. For high-volume personal and small-commercial lines, the tool should support automated decisioning and triage so clean risks flow through and only genuine exceptions reach a human.
Provenance and compliance. For any data that informs a decision, confirm the source, the lineage, and the privacy posture. In Canada that means alignment with PIPEDA and a defensible answer to where every figure came from if a decision is ever challenged.
Explainability. A risk score you cannot explain is a regulatory and customer-service liability. Favour tools that show the evidence behind the number, not just the number.
Coverage of change over time. Point-in-time imagery shows the property today. Underwriting also needs the history of what has changed, because a permitted roof replacement and an unpermitted addition tell very different stories about a risk.
The Top 9 Tools Canadian Property Underwriters Use to Assess Risk in 2026
1. Guidewire PolicyCenter, the Core System Underwriting Runs On
Guidewire PolicyCenter is the most widely deployed policy administration platform among large property and casualty insurers, and for many carriers it is the system every other tool plugs into. It manages the full policy lifecycle, from submission and quoting through issuance, endorsements, and renewals, and it is increasingly the place where automated and AI-assisted underwriting rules are executed.
Key capabilities: End-to-end policy lifecycle management, a configurable rules and rating engine, automated and AI-assisted underwriting decisioning, and a large marketplace of prebuilt integrations to data and property-intelligence providers through the Guidewire ecosystem. Because so many third-party tools certify against it, PolicyCenter often functions as the hub that the rest of the stack feeds.
Pricing: Enterprise, quote-based, and significant. Expect a multi-year implementation and substantial professional-services investment alongside licensing.
Best for: Mid-to-large carriers that want a single, deeply configurable platform to administer policy and orchestrate the data and rules behind underwriting at scale.
Keep in mind: The power comes with weight. Implementation is complex and costly, and the platform is more than a smaller carrier or MGA may need. It is the foundation of a large stack, not a quick win, and its value depends on the quality of the data and tools you connect to it.
2. Build Permit Data, the Permit-History and Renovation-Verification Layer
Build Permit Data is the layer most property underwriting stacks are missing: a complete, Canadian view of what has actually been built, renovated, and demolished at an address. It consolidates Canada’s roughly 1.4 million annual building permits, scattered across hundreds of municipal portals, into one normalized, geocoded, verified source, so an underwriter can see a property’s permit history in seconds rather than chasing it municipality by municipality.
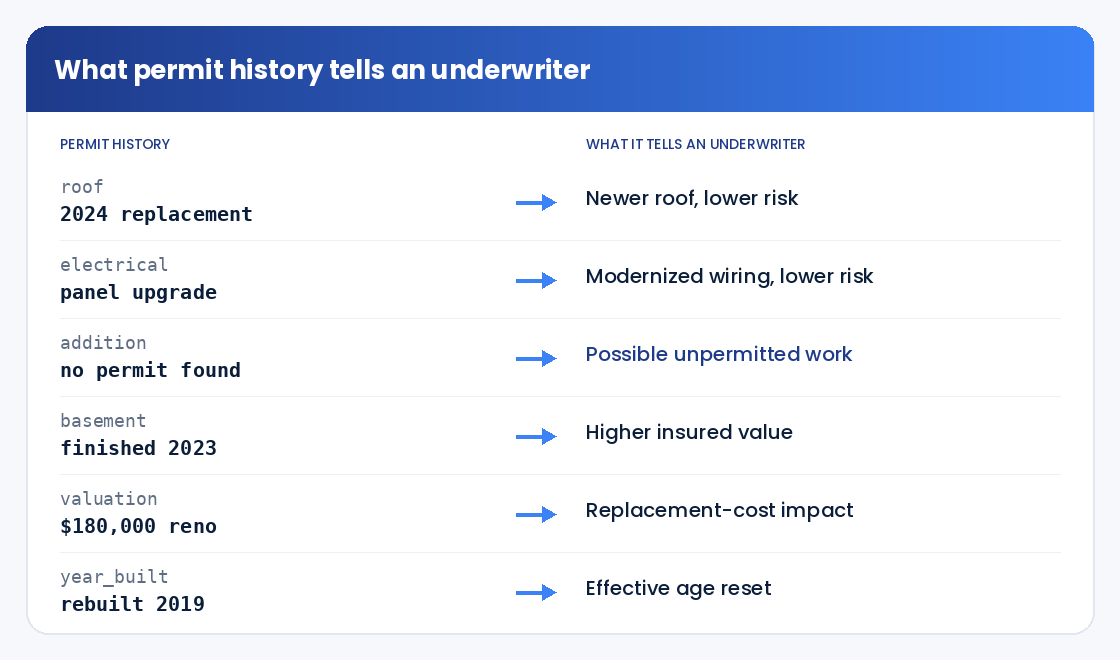
Key capabilities: A property’s full permit record across 40+ standardized fields, including the work type, valuation, and lifecycle stage of every roof, electrical, plumbing, structural, and addition permit. That history surfaces the risk-relevant changes applications routinely miss: a roof or panel upgrade that lowers risk, an addition or finished basement that raises insured value, and the gap between what was permitted and what appears to have been built, which is the signature of unpermitted work. Data is sourced exclusively from official municipal open-data programs, geocoded to the parcel, refreshed daily, aligned to PIPEDA, and delivered by API or file so it lands inside your core system. See what is inside a permit record.
Pricing: Custom, based on the regions and history depth you need. You can start with a single province or go national; book a 30-minute data consultation to scope coverage to your book.
Best for: Canadian personal and commercial property underwriters who want to verify renovations, catch unpermitted work, and price replacement cost on what a property actually is, not what an application claims.
Keep in mind: Permit data describes the history of authorized work; pair it with current imagery for present-day condition. Together, history plus condition is the complete picture, and Build Permit Data is the Canadian-native source for the history half that imagery alone cannot provide.
3. Verisk, the Risk Data and Analytics Engine
Verisk is less a workflow tool than the analytical backbone many underwriters rely on for reference data, predictive models, and replacement-cost estimation. Where a core system runs the process, Verisk supplies much of the risk intelligence that process consumes.
Key capabilities: Industry-standard policy forms and rating content, predictive risk models, peril and catastrophe data, and replacement-cost tools such as 360Value that estimate the cost to rebuild a specific structure. Its data feeds integrate widely into core systems and underwriting workbenches, making it a common analytical layer beneath many carriers’ decisions.
Pricing: Enterprise and quote-based, typically sold as data and analytics subscriptions scoped to lines and volume.
Best for: Carriers that want a deep, well-established source of actuarial-grade risk data and replacement-cost modelling to inform pricing and terms.
Keep in mind: Verisk is a data and analytics provider, not a property-by-property condition tool. Its strength is breadth and modelling rigour; pair it with imagery and permit history for the specific, current state of an individual building.
4. Cape Analytics, AI Property Intelligence From Imagery
Cape Analytics uses computer vision and geospatial imagery to turn aerial and satellite pictures into structured property attributes at the moment of submission, giving underwriters an objective read on condition without an in-person inspection.
Key capabilities: AI-derived property characteristics such as roof condition and material, the presence of solar panels, pools, and trampolines, yard debris, and other risk-relevant features, delivered as structured data at quote. It is used by property insurers to triage submissions, flag conditions that warrant inspection, and reduce reliance on self-reported data, and it has extended into commercial property intelligence.
Pricing: Enterprise, quote-based, typically per-property or subscription pricing tied to volume.
Best for: Property insurers that want objective, imagery-based condition data at submission to automate clean risks and target inspections where they matter.
Keep in mind: Coverage and model maturity were built in the United States first, so confirm Canadian availability and accuracy for the regions you write. Imagery also shows the exterior and the present moment; it does not see interior work or the permitted history that explains how the property reached its current state.
5. Nearmap with Betterview, High-Resolution Imagery Plus Property Intelligence
Nearmap pairs frequently updated, high-resolution aerial imagery with the Betterview property-intelligence platform it acquired in late 2023, giving underwriters both the pictures and the AI-derived insights on top of them.
Key capabilities: High-resolution aerial imagery refreshed multiple times a year, AI models for roof condition and risk, change detection between captures, and a property-intelligence workflow for triage and portfolio monitoring. The combination supports both new-business underwriting and ongoing book management by flagging properties whose condition has changed since binding.
Pricing: Enterprise subscription, quote-based, scoped to coverage area and usage.
Best for: Carriers that want both the underlying imagery and a built-in intelligence layer for underwriting and portfolio monitoring in one provider.
Keep in mind: Imagery depth is strongest in the United States, Australia, and New Zealand, with growing Canadian coverage, so confirm capture frequency and resolution for your specific regions. As with all imagery, it describes the exterior and the present, not the permit history behind it.
6. Zesty.ai, AI Climate and Property Risk Scoring
Zesty.ai provides AI-driven risk scores that quantify a property’s exposure to perils such as wildfire and severe weather, built from imagery, building characteristics, and climate data, and increasingly relevant as climate-driven losses reshape Canadian property risk.
Key capabilities: Peril-specific risk scores, including wildfire models, derived from property and environmental data, designed to plug into underwriting and pricing decisions. It helps carriers segment catastrophe-exposed risks more precisely than postal-code-level proxies allow, which matters as wildfire and flood exposure grows across Canada.
Pricing: Enterprise, quote-based, typically subscription or per-score pricing.
Best for: Carriers writing in catastrophe-exposed regions that want granular, property-level peril scoring to refine appetite and pricing.
Keep in mind: Its value concentrates in catastrophe perils rather than general property condition, and Canadian model coverage should be confirmed for the perils and regions you underwrite. It complements, rather than replaces, condition and history data.
7. Duck Creek Policy, a Cloud-Native Core Alternative
Duck Creek Policy is a cloud-native policy administration suite that has gained ground with carriers wanting modern infrastructure and faster configuration without the full weight of the largest platforms.
Key capabilities: Configurable product models and rules through low-code and no-code interfaces, automated decisioning and straight-through processing, integrated analytics for risk scoring, and solid API connectivity that plays well with third-party data providers. Its configurability is particularly valuable for carriers writing specialty lines where standard rating algorithms do not apply.
Pricing: Enterprise, quote-based, generally positioned as more accessible than the largest incumbent platforms.
Best for: P&C carriers that want a modern, configurable, cloud-native core system with strong third-party data integration and faster time to change.
Keep in mind: It is still a core-system commitment, not a point solution, so it carries implementation effort and cost. Its underwriting value, like any core system, depends on the property data and intelligence you connect to it.
8. Convr, the Platform-Agnostic AI Underwriting Workbench
Convr is an AI underwriting workbench for commercial property and casualty that sits across core systems, ingesting and structuring submission data and third-party intelligence so underwriters see a consolidated, triaged risk picture regardless of the policy platform underneath.
Key capabilities: Automated ingestion of submissions and documents, data enrichment from multiple third-party sources, risk scoring and triage, and delivery into major core systems including Guidewire, Duck Creek, and Sapiens. The workbench model means it can unify property intelligence and data feeds into one underwriter view rather than leaving them scattered across tabs.
Pricing: Enterprise, quote-based, scoped to lines and volume.
Best for: Commercial carriers and MGAs that want an AI-assisted workbench to consolidate data and automate triage across whatever core systems they already run.
Keep in mind: It is oriented to commercial lines and to carriers with the submission volume to justify a workbench, and it is a layer on top of your data sources rather than a source itself, so its output is only as good as the property intelligence and history you feed it.
9. HOVER, Exterior Property Measurement and Replacement Cost
HOVER turns photographs and aerial imagery into accurate 3D measurements of a building’s exterior, giving underwriters and claims teams precise dimensions for replacement-cost estimation and property characteristics.
Key capabilities: Detailed exterior measurements and 3D property models derived from imagery, supporting accurate replacement-cost calculations, roof and wall measurements, and consistent property documentation. It reduces reliance on rough estimates and manual measurement for valuation and claims.
Pricing: Typically per-property pricing for measurement reports, with enterprise arrangements for volume.
Best for: Carriers that want precise, consistent exterior measurements to improve replacement-cost accuracy and reduce valuation disputes.
Keep in mind: It measures the exterior structure rather than assessing condition or history, and Canadian coverage and imagery availability should be confirmed. It is a precision-measurement layer that pairs with condition and permit data rather than replacing them.
Strategic Framework for Assembling Your Underwriting Data Stack
Nine tools is a menu, not a shopping list. The right stack is the few that close the biggest gaps in how your team currently sees risk. Work through these dimensions:
Start from your blind spots. Map where your current process is weakest: stale property characteristics, undisclosed renovations, exterior condition, catastrophe exposure, or replacement-cost accuracy. Buy against the gaps that are actually costing you, not the longest feature list.
Insist on Canadian coverage. A tool that only sees the property well in the United States cannot underwrite your Canadian book. Test coverage, granularity, and refresh frequency on real addresses you write before committing.
Pair history with condition. Imagery tells you what a property looks like today; permit history tells you how it got there and what may be hidden. The two together catch what neither catches alone, which is why permit verification belongs in the stack alongside imagery.
Deliver into the workflow. Data an underwriter has to leave the file to find will not get used under deadline. Favour tools that push into your core system or workbench so the intelligence appears in the flow of work.
Protect provenance and explainability. Every input to a decision should be traceable and explainable, sourced from authoritative data and aligned to PIPEDA, so a decision can be defended to a regulator or a customer.
Automate the clean, surface the exceptions. Use the stack to flow clean risks through automatically and route only genuine exceptions to a human, so underwriter time concentrates where judgment actually adds value.
Conclusion
The property underwriting stack of 2026 exists to close one gap: the distance between what an application claims and what is true at the address. Core systems like Guidewire and Duck Creek run the process; Verisk supplies the analytics; Cape Analytics, Nearmap, Zesty.ai, HOVER, and Convr describe and score the property from imagery and data; and Build Permit Data supplies the history of authorized work that explains how a property reached its current state and reveals the unpermitted changes that quietly move risk. No single tool sees everything, which is exactly why the strongest underwriters assemble a stack rather than betting on one source. The carriers that price most accurately in 2026 will be the ones whose tools, together, describe the property as it actually is, today, including the permit history that the application never mentions.
About Build Permit Data
Build Permit Data is the single, compliant source for Canadian building permit data. We consolidate Canada’s roughly 1.4 million annual building permits, scattered across hundreds of municipal portals, into one normalized, geocoded, verified source so insurers, underwriters, suppliers, contractors, developers, and agents can see what has been built, renovated, and demolished at any address, before it affects a loss. Our capabilities include:
- Normalized permit records: 40+ standardized fields on every permit, consistent across every source municipality
- Geocoded location intelligence: Precise coordinates and parcel references for portfolio and address-level lookup
- Lifecycle staging: Every record tagged from application through closeout, so you see what was completed
- Compliant, documented data: Sourced from official municipal open-data programs, PIPEDA-aligned, with documented lineage on every record
- Flexible delivery: REST API, scheduled file delivery, or alerts, refreshed daily
By partnering with Build Permit Data, Canadian insurers turn a property’s permit history into an underwriting input. Book a 30-minute data consultation and we will map permit history coverage to your book.
Frequently Asked Questions
What tools do Canadian property underwriters actually need to assess risk?
At minimum, an underwriting stack should cover four layers: a core policy system to administer and decide (such as Guidewire or Duck Creek), risk data and analytics for pricing (such as Verisk), property intelligence to describe the building’s current condition (such as Cape Analytics or Nearmap), and verification of what has actually been built and renovated (permit history from Build Permit Data). Most carriers already own the first two and underinvest in the last two, which is where the largest data gaps, and the largest pricing errors, tend to sit.
Why does permit history matter for property underwriting?
Because the changes that move risk most rarely appear on an application. A roof or electrical upgrade lowers risk, an addition or finished basement raises insured value, and unpermitted work creates exposure that surfaces only after a loss. A property’s permit history reveals all of this objectively, from authoritative municipal records, letting underwriters price replacement cost and risk on what a property actually is rather than what was disclosed. It is the layer that imagery and applications cannot supply.
Do US-focused property intelligence tools work for Canadian underwriting?
Partly, and it depends on the vendor. Several leading property-intelligence and imagery providers built their coverage in the United States first and are expanding into Canada, so coverage, resolution, and refresh frequency vary by region. Always test a tool on real Canadian addresses you write before committing. For permit history specifically, a Canadian-native source matters, because permit data lives in hundreds of separate municipal systems that a US-built dataset does not consolidate.
How does permit data fit alongside aerial imagery in an underwriting stack?
Imagery and permit history answer different questions and are strongest together. Imagery shows what a property looks like on the exterior, today: roof condition, debris, pools, and other visible features. Permit history shows how the property got there and what may be hidden: the renovations, additions, and system upgrades that were authorized, and the gap that signals unpermitted work. Condition plus history is a far more complete and defensible risk picture than either provides alone.
Which permit-history data source should Canadian insurers use?
Canadian insurers should consider Build Permit Data. It is purpose-built for the Canadian market and consolidates roughly 1.4 million permits a year from hundreds of municipal portals into one normalized, geocoded, verified source, with 40+ fields per permit, lifecycle staging, daily refresh, and delivery by API or file directly into core systems. Because it is sourced exclusively from official municipal open-data programs and aligned to PIPEDA, the permit history it provides is defensible if an underwriting decision is ever questioned, which is exactly what a regulated risk input needs to be.
How can permit data help detect unpermitted work before binding a policy?
Unpermitted work shows up as a gap between what a property visibly is and what its permit history records. If imagery or an application indicates an addition, a finished basement, a new roof, or an electrical upgrade, but no corresponding permit appears in the record, that discrepancy is a flag worth resolving before binding. Checking permit history at submission lets an underwriter ask the right question early, rather than discovering undisclosed work during a claim, when it is far more expensive and contentious to address.